Make Your Data Clear and Actionable with Visual Insights
At WeTrackAds, we make data work for you by leveraging BigQuery and LookerStudio to turn raw data into valuable insights. We automate the process of sending your data to BigQuery, where it’s stored and organized. Then, we write custom SQL queries and create views that pull together data from multiple sources, applying complex logic to ensure you get the most accurate and relevant information. This approach provides a unified view of your key KPIs, such as Cost per Lead, Cost per Sale, Lead to Sale Rate, ROAS, and more.
Before
- Switching between multiple reports for a complete view.
- Outdated or inconsistent data leads to poor decision-making.
- Difficulty tracking important KPIs.
- Manual data aggregation across platforms.
After
- All data in one place, no switching between reports.
- Reliable, real-time data for better decisions.
- Track Cost per Lead, Cost per Sale, Lead to Sale Rate, ROAS, and more.
- Effortless data aggregation from all sources.
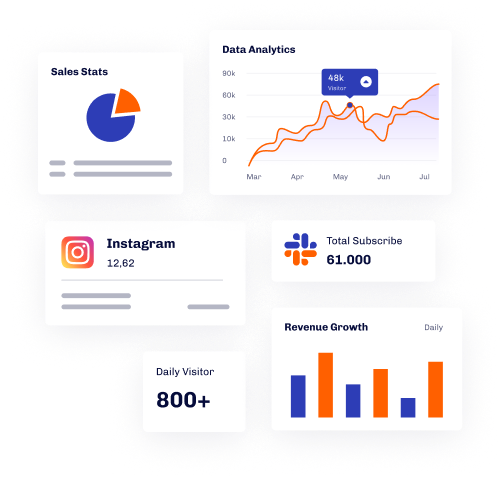
Data Visualization Explained
WeTrackAds simplifies data management by automating the flow of information from all your marketing platforms directly into BigQuery, ensuring that all your data is stored in one centralized location. Once in BigQuery, we craft tailored SQL queries and views to process and merge data from various sources, applying custom logic to generate the most relevant insights for your business. With LookerStudio, we transform this data into visually compelling reports that showcase critical metrics like Cost per Lead, Lead to Sale Rate, Cost per Sale, and ROAS, giving you a comprehensive, real-time view of your campaign performance. This seamless integration allows you to monitor your ROI and optimize strategies with ease, without the need for constant manual updates.
How Data Visualization Works
- Automated Data Ingestion
- Queries & Views Creation
- Data Visualization
- Daily Monitoring
Ready to Unlock Actionable Insights?
Schedule a Call with WeTrackAds and let us help you transform your data into clear, impactful visualizations that drive smarter decisions and optimize your campaign performance.
















Success Stories
At WeTrackAds, our clients rely on us for accurate tracking and impactful marketing results. Here’s how we’ve helped businesses grow and succeed, driving measurable outcomes and lasting success.

Rob Llewellyn
As the owner of rapidly growing online business, I have found Sohail to be a tremendous help to me over the last few years. When I run into technical tasks that are beyond my basic level, Sohail is my go-to expert. He’s been an absolute whizz with any piece of technology or integration I’ve thrown his way. His work is fast and efficient and I trust him. I can’t recommend Sohail enough.

William Brown
Sohail has been such a pleasure to work with, he really has. He helped us with our web development and functionality and also went out of his way to make adjustments for us on very short notice. Genuinely, I'm thankful to have Sohail within my network. Highly recommended.

Dominic Bargeton
Sohail has been incredibly professional, meticulous, and thorough while helping us create a custom automation tool tailored to our business. His expertise and efficiency were genuinely remarkable. I highly recommend his exceptional services to anyone in need.

Shaqir Hussyin
Sohail has been such a joy to work with, always delivering prompt, efficient, and reliable support. He consistently goes above and beyond, ensuring every detail is thoroughly covered. Truly, I’m incredibly grateful to have Sohail in my network. Highly recommended.

Marilyn Rose Sandoval
Sohail is reliable and professional. He is a person who just gets the job done

Jennifer McLean
Sohail is very proficient in everything I asked him to do around funnels, online tech, affiliate program, Zapier integration, ClickFunnels and especially automations and scaling projects, and much more. He is a huge asset to have supporting your business. He is prompt and gets the job done. He is an excellent communicator and thinks things through for each project. I highly recommend Sohail. ! Jennifer McLean, CEO McLean MasterWorks & Creator of The Spontaneous Transformation Technique

Kenneth M. Milosovic
Sohail is the best web guy I have ever used hands down. I don’t know how he’s so fast at what he does?

Sue R. Levy
Sohail is EXCELLENT! I recommend him with enthusiasm and not a single reservation. He is a talented designer and a pleasure to work with. He created the logo for my company - and I use him on all my projects that require a graphic designer. He turns projects around quickly and is very reliable.

Brian Arredondo
When I first started Executive Technology Solutions I hosted a competition for my business logo. Sohail not only delivered by far the best product, but his rates are reasonable, and he was perfect on the commuhnication. He is super creative, and I have hired him since. HE does great work, so give him a shot! HIGHLY EXPERIENCED PROFESSIONAL. Thanks Sohail for all your help.
