Top 10 SEO Reports in Google Analytics 4 | Complete Guide
Many users open Google Analytics 4 but feel lost. They see many reports but do not know which ones matter for SEO. This leads to poor decisions and missed growth opportunities. GA4 offers powerful reports, but you need to focus on the right ones. In this guide, you will learn the top SEO reports that help you track traffic, measure performance, and improve your results.
Why Google Analytics 4 is Important for SEO
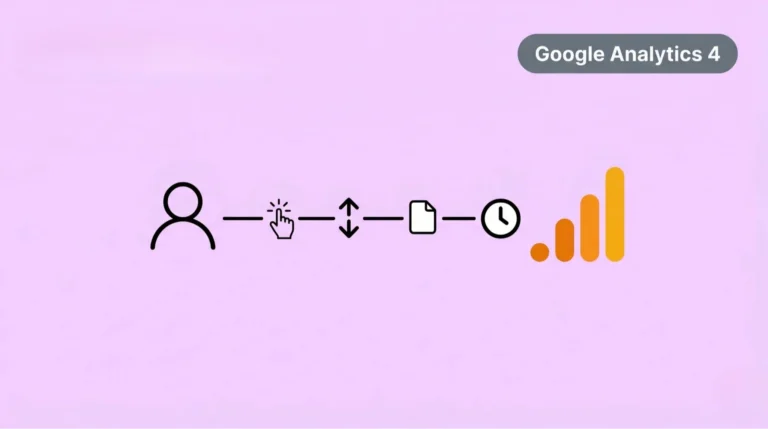
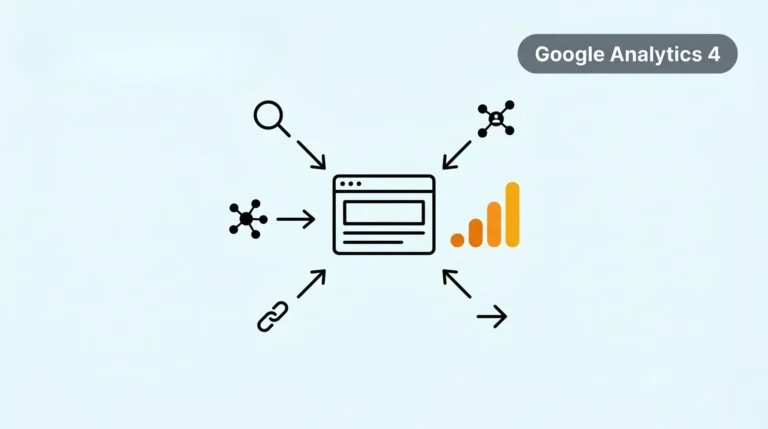
GA4 helps you understand how your SEO performs. It shows where your traffic comes from and how users interact with your site, but it does not provide full keyword data in GA4, which is important for deeper SEO analysis. You can track which pages bring organic traffic and which content keeps users engaged. This helps you focus on high-performing pages and improve weak areas.
GA4 also shows how users move across your site and where they drop off. You can identify user experience issues and fix them faster. It helps you connect traffic with conversions and measure real SEO results. With this data, you can answer key questions:
These insights help you improve rankings, increase traffic, and grow conversions.
1. Conversions Report
The Conversions report in Google Analytics 4 shows what users do after landing on your site. It tracks actions like form submissions, purchases, and sign-ups. This helps you measure the real impact of your SEO efforts. Many sites focus only on traffic, but traffic without conversions has no value.
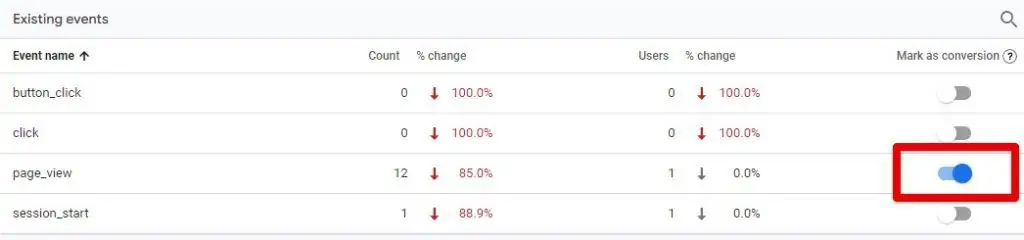
You need to know which pages and keywords lead to results. GA4 tracks these actions through events, which you can mark as conversions. This setup helps you connect SEO traffic with real business goals. To see conversions in GA4, go to Reports, then open Engagement and click on Conversions. You will see a list of actions users complete on your site,.
You can also go to Admin, open Events, and turn on the “mark as conversion” option for important actions. Focus on key actions like form submissions, purchases, and lead generation. This report helps you understand which traffic converts and where you need to improve.
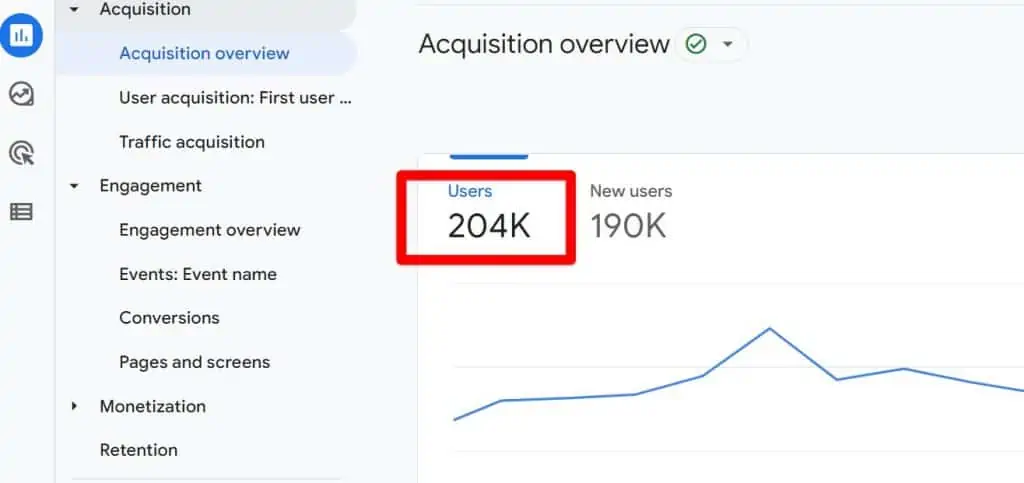
2. Traffic Acquisition Report
The Traffic Acquisition report in Google Analytics 4 shows where your traffic comes from. It helps you understand how users find your website through different channels.
This report is important for SEO because it shows your organic traffic performance. You can compare organic search with other sources like direct, referral, or social traffic. This helps you see how much traffic SEO brings to your site.
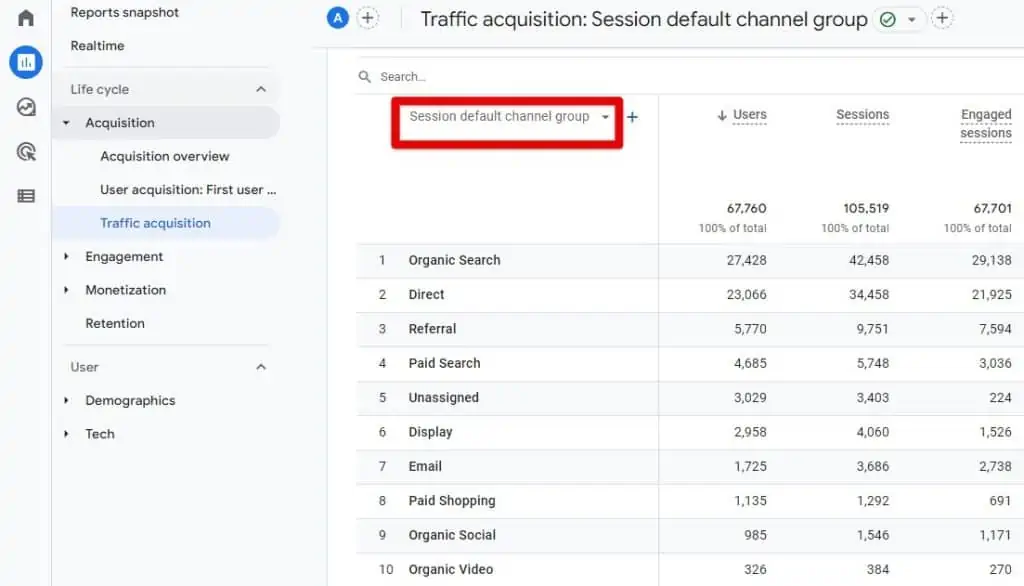
To access this report, go to Reports → Acquisition → Traffic Acquisition. You will see data based on source and medium. Change the dimension to Session source/medium to get more detailed insights.
Focus on organic traffic and analyze key metrics like Users, Sessions, and Engagement rate. This helps you measure SEO performance and find growth opportunities.
3. Referral Traffic Report
The Referral Traffic report in Google Analytics 4 shows which websites send traffic to your site. This traffic comes from external links, not search engines.
This report helps you understand your backlink performance. Strong referral traffic often means your site gets mentions from other websites. This improves your SEO authority and increases visibility.
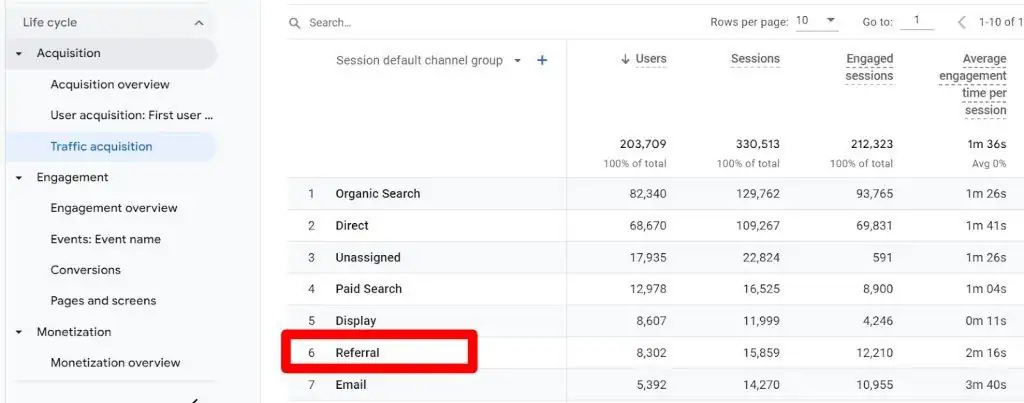
To see referral traffic, go to Reports → Acquisition → Traffic Acquisition. In the table, change the dimension to Session source/medium. Then look for traffic labeled as referral.
You can also check which websites send the most traffic. Focus on sources that bring engaged users and conversions. This helps you find partnership and link-building opportunities.
4. Landing Page Report
The Landing Page report in Google Analytics 4 shows the first page users visit on your site. It helps you understand which pages attract organic traffic.
This report is important for SEO because landing pages act as entry points. You can see which pages rank well and bring users from search engines. It also shows how users interact with those pages.
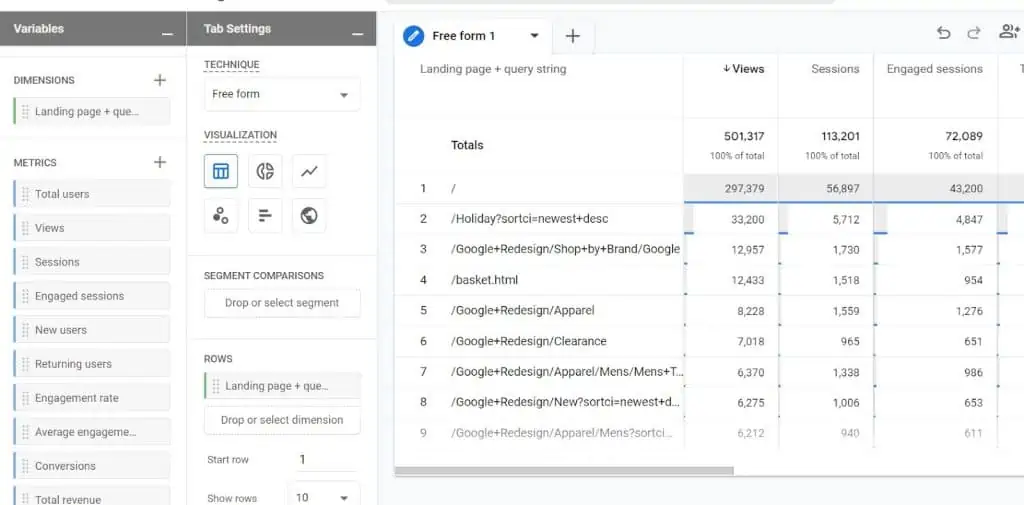
To view this report, go to Reports → Engagement → Pages and screens. Change the dimension to Landing page to see entry pages. You can also build a custom report using Explorations for deeper analysis.
Focus on pages with high traffic and strong engagement. Improve pages with low performance to increase traffic and conversions.
5. Search Console Report
The Search Console report in Google Analytics 4 shows how your site performs in Google search. It pulls data from Google Search Console and connects it with your GA4 reports.
This report helps you see which keywords bring traffic and how your pages perform in search results. You can track clicks, impressions, CTR, and average position. This gives you a clear view of your SEO performance.
To access this report, go to Reports → Acquisition → Search Console. You will find two main reports: Queries and Landing Pages. Queries show search terms, while landing pages show which pages get traffic from search.
Use this data to find high-performing keywords and improve low-CTR pages. This helps you optimize content and increase organic traffic.
6. Site Speed and Performance Report
Site speed impacts SEO and user experience. Slow pages increase bounce rate and reduce conversions. Users expect fast-loading pages, especially on mobile devices.
Google Analytics 4 does not provide a default site speed report. This feature existed in Universal Analytics but is missing in GA4. You need external tools to track page speed data.
You can recreate this report using Google Tag Manager or connect GA4 with BigQuery. These tools help you send performance data into GA4. However, BigQuery requires technical knowledge and setup.
Focus on key performance metrics like page load time, server response time, and page speed. You can also analyze user behavior in GA4 to spot slow pages. Check pages with high traffic but low engagement and improve their speed.
7. User Retention Report
The User Retention report in Google Analytics 4 shows how many users return to your site over time. Returning users are more likely to convert because they already trust your content.
This report helps you measure how well your content keeps users engaged. A higher number of returning visitors means your SEO and content strategy works well. If users do not return, you need to improve content value and user experience.
To view this report, go to Reports → Lifecycle → Retention. You will see data for new vs returning users and how often users come back.
You can also measure retention using a simple method. Divide returning users by total users for a selected period. Track this weekly or monthly to see trends and improvements.
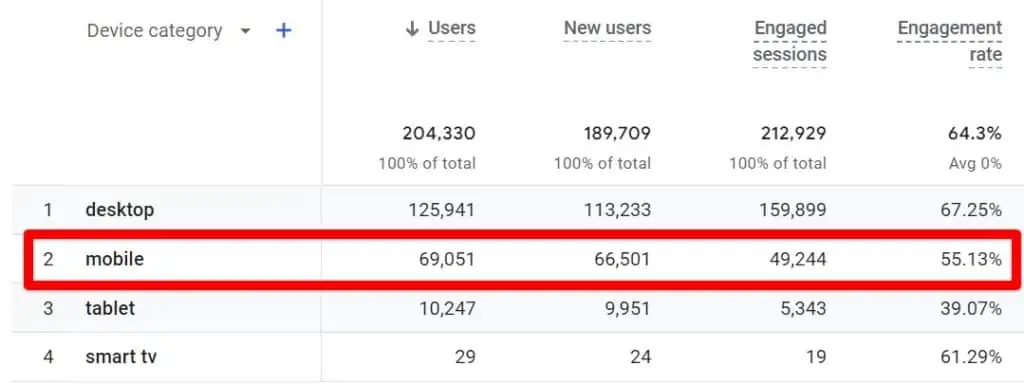
8. Mobile and Device Report
The Mobile and Device report in Google Analytics 4 shows how users access your site across devices. It helps you compare performance on mobile, desktop, and tablet.
Most users visit websites on mobile devices. If your site does not perform well on mobile, you lose traffic and rankings. Google also prioritizes mobile-friendly websites in search results.
To view this report, go to Reports → User → Tech details. Change the dimension to Device category to see mobile, desktop, and tablet data.
Compare engagement, bounce signals, and conversions across devices. If mobile performance is low, improve page speed, design, and usability. This helps you increase traffic and improve SEO results.
9. Reports Snapshot (Automated Insights)
The Reports Snapshot in Google Analytics 4 gives a quick overview of your performance. It shows key metrics, trends, and changes in one place. This helps you spot issues without checking multiple reports.
You can quickly see traffic changes, top pages, and user activity. This report saves time and helps you focus on important data. It is useful for daily SEO monitoring and quick analysis.
Automated Insights
GA4 automatically detects trends and unusual changes in your data. It can highlight traffic spikes, drops, or sudden behavior changes. These insights help you identify problems or opportunities faster.
Custom Insights
You can create custom alerts based on your needs. Set conditions like traffic drops or conversion changes. GA4 will notify you when these conditions occur, so you can take action quickly.
10. Looker Studio for SEO Reporting
Looker Studio helps you create custom SEO dashboards. It allows you to visualize data in a simple and clear format.
You can connect Google Analytics 4 with other tools and combine all your data in one place. This includes traffic, keywords, and conversions. It makes analysis faster and more organized.
With Looker Studio, you can build reports based on your needs. You can track SEO performance, compare metrics, and share reports with clients or teams.
This tool helps you turn raw data into clear insights. It improves reporting and supports better SEO decisions.
How to Use These SEO Reports Together
Each report in Google Analytics 4 gives part of the picture. You need to combine them to understand your SEO performance fully, which is the core idea behind web analytics.
Start with the Traffic Acquisition report to check organic traffic. Then use the Landing Page report to see which pages bring that traffic. After that, check the Conversions report to measure results from those pages.
Use the Search Console report to connect keywords with landing pages. Then review engagement and retention reports to understand user behavior. This shows what works and what needs improvement.
When you connect all these reports, you get a clear SEO strategy. You can find gaps, improve content, and focus on actions that drive traffic and conversions.
Summary
Google Analytics 4 offers powerful reports to track SEO performance. Each report shows a different part of your data, from traffic to conversions. Use these reports together to understand what works and where to improve. Focus on high-impact pages, track user behavior, and optimize for better results. Start analyzing your reports regularly and make data-driven decisions to grow your traffic and conversions.